Cate Triendl
0 min read
How Hospitality Operators Can Use Data To Reveal Loyal Customers

Identifying your loyal customer base shouldn’t be a gut feeling that it exists in some way.
You can and should put a real number on how many you have.
All you need is the right tools and access to customer loyalty data.
You want to dig really deep into your data to get valuable insights from your loyalty numbers.
Here’s everything you need to know to define concrete loyalty for your business.
Customer loyalty data sources
There are many possible in-venue and online sources that you can use to gain customer loyalty data.
Some examples:
- WiFi logins from your Guest WiFi
- Interactions from your loyalty program
- Bookings made via your booking system
- Transactions from your POS
- Purchases from your E-commerce
What you want to learn from this data is the number of interactions each customer had over a certain period of time.
Next, you need to narrow down this data a bit further.
Segmentation to identify loyal customers
Segmenting your data will help you to spot common behaviours that determine how engaged and loyal your customers are.
You are looking for patterns in the data here.
Key metrics to look out for:
- How much do they spend on average in-venue and / or online
- How often do they visit/book during a period of time
- How engaged are they with your loyalty scheme, e.g. number of stamps, frequency of points
- How often do they book special events
This helps you to spot trends, i.e. the frequency of bookings per month goes down after the 3rd visit.
From this, you can then take relevant action.
For example, set up an automated email to customers who have been at your venue 3 times. Feature some of your venue highlights and invite them to come back.
Clever analysis tool: retention cohort report
In addition and to get a black-and-white percentage of customers that have repeatedly returned over a time period, you can create a retention cohort chart.
But before you fire up a new spreadsheet and start manually adding your data, there might be a better and quicker solution readily available.
Making sense of your retention cohort report
A lot of e-commerce and other tech software comes with an automatically created retention report as part of their analytics feature.
Such a report might look a little complicated at first but is quite easy to read and understand.
The image below shows an example.
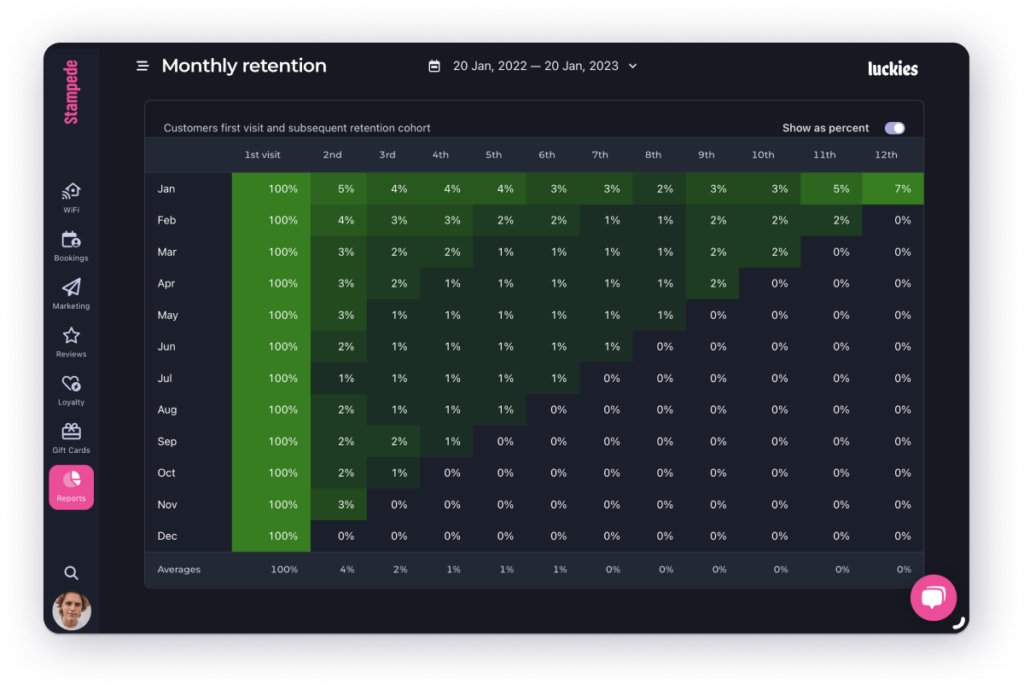
The left column refers to the selected monthly time interval. The top column represents the number of subsequent visits.
The chart starts with the first visit which is the total number of customers in that particular month. This will be your reference number moving forward.
Reading from left to right, it shows you how many of those initial customers have reached their number of return visits (along the top row)
The report displays cohorts. So each return visit number is a separate group with customers that share one characteristic: their number of return visits.
As a consequence, customers can only ever be in one cohort at a time, and there is no overlap.
What actions can you take from this report? You can, for example, build segments from your cohorts and create tailored marketing campaigns for them.
Someone who has visited 10 times will expect different communications from someone who has only visited 2 times.
Stop guessing and start measuring your customer loyalty with real data and the Stampede Guest Experience Platform.